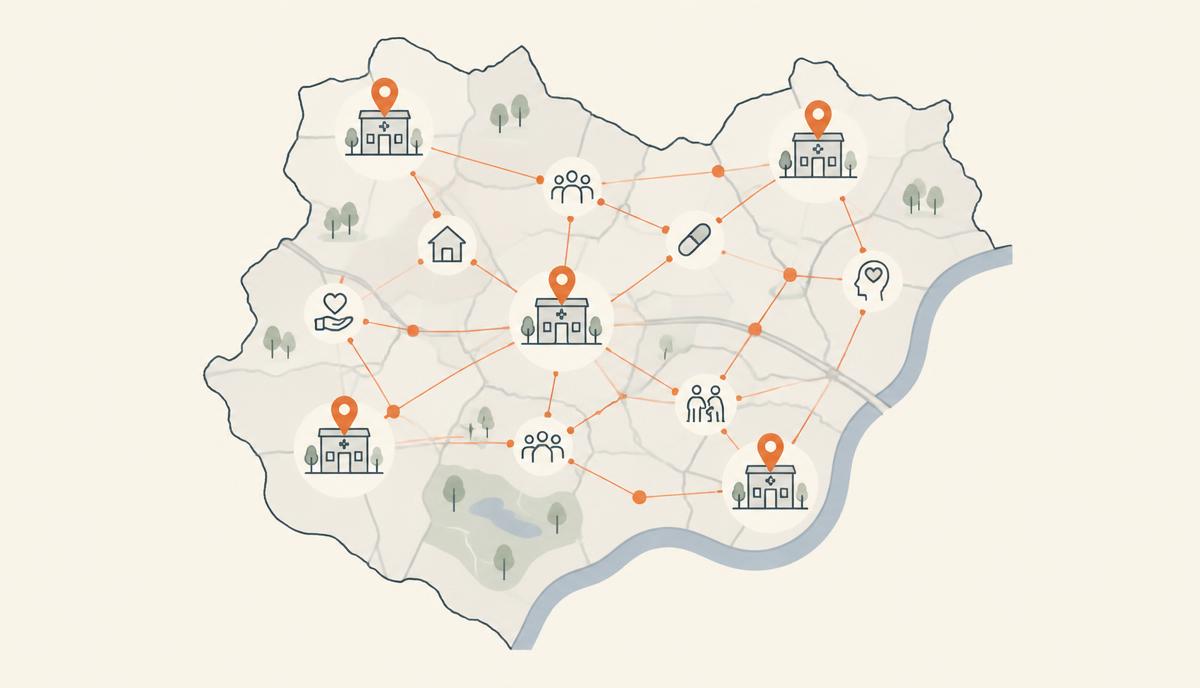
Most PCN planning starts with the disease registers. They show how many patients you have with hypertension, diabetes, COPD or depression today, and they drive much of the work your practices already do.
But registers look backwards. The question a clinical director needs to answer is a different one: how many patients will we have on each register in 2030, and are we ready for them?
Why prevalence moves
Condition prevalence in a PCN does not stand still. It shifts with the age of your population, with new housing and the people who move into it, with deprivation, and with how well conditions are being found and recorded. An ageing list can add patients to long-term condition registers year after year, even if nothing else changes.
Each of those extra patients means annual reviews, appointments, prescriptions and, for some, referrals. Small percentage rises become real numbers of clinic hours.
What projected prevalence lets you plan
- Workforce. How many additional reviews a year will your hypertension or diabetes registers need, and which ARRS roles are best placed to absorb them?
- Clinic capacity. Where across your neighbourhoods will demand grow fastest, and is that where your clinics and rooms are?
- Prevention. If case finding or an intervention slowed the rise, how many fewer patients would be on the register in 2030? That is the number that turns a prevention idea into a business case.
- Prescribing. What would a growing or shrinking register mean for medicines spend in your area?
Why it is hard to do today
Projecting prevalence properly means combining condition data with population projections, housing growth and local demographics, for your PCN footprint rather than a whole ICB. For most PCNs that has meant waiting for an analyst, or not doing it at all.
How Coplug helps
The Coplug Healthcare Agent holds a pre-built baseline for your PCN from 500+ verified datasets. You ask in plain English, for example "How is diabetes prevalence in my PCN projected to change by 2030?", and get an answer mapped to your neighbourhoods, with the source behind every figure. You can then test scenarios: what if the rise were halved, or what if a new development went ahead?
Teams are already using this kind of evidence. Kent and Medway used Coplug to build cancer insights across their footprint, and our article on long term forecasting shows the kinds of questions you can ask.
Ask the Healthcare Agent about your PCN's prevalence to 2030, free to start, no card needed.