Systems are agreeing neighbourhood footprints in 2026/27 under the Neighbourhood Health Framework. Integrated Neighbourhood Teams are being organised around them, and Neighbourhood Health Plans follow from 2027/28. These footprints will become the denominator for needs assessment, resource allocation and outcome monitoring. Little has yet been published on how they should be defined.
If a golden thread of linked, patient-level data ran across every relevant dataset, the question of how to define a neighbourhood would largely have been settled. It has not, because that thread does not exist. A meaningful neighbourhood profile can draw on more than 100 separate data sources, held at different levels: a large proportion at primary care provider level, others at census geographies such as LSOA and MSOA, and others again at the level of individual assets such as pharmacies, clinics and community venues. Combining them requires a common geography, and the method used to define that geography determines which population each indicator describes. A simplistic method carries a substantial risk of analysing the wrong population. That undermines both the identification of appropriate interventions and the monitoring of improvement in the population a neighbourhood team actually serves, which together are the central purpose of neighbourhood planning.
Two methods are in common use for defining neighbourhoods. The first is a defined boundary, built on a first past the post rule: each Lower Layer Super Output Area (LSOA) is allocated in full to the PCN with the most registered patients resident in it. The second is proportional attribution: each LSOA is divided between the PCNs that serve it in proportion to their registered patients, and each PCN's catchment is the weighted set of LSOAs it draws from.
Public health analysis gives priority to the validity of the denominator. Proportional attribution keeps every patient attributed to the PCN they are registered with, so population totals reconcile with registered lists, while still producing a catchment that can be mapped for each PCN. A senior public health analyst, reviewing the method:
“Wow. I think that makes a lot of sense to me, and I’m a lot more comfortable with doing that. It seems like the best of both worlds to me.”
“I’m completely on board of us all using the same lookup. It makes complete sense.”
Senior public health analyst (both comments, same speaker)
Key messages
- The Neighbourhood Health Framework asks for footprints of 30,000 to 60,000 people around natural communities. It does not specify a method, and none has been published.
- Catchments overlap: 64% of the 1,795 LSOAs analysed are served by two or more PCNs.
- First past the post misclassifies 19.5% of registered patients and moves 48% of PCN populations by 10% or more from their registered list sizes.
- The error falls on the denominator and propagates into every rate, trend and projection derived from it.
- Proportional attribution removes this bias and allows each indicator to be weighted, or not, according to what the data supports.
1. No method has been published
The Neighbourhood Health Framework asks systems to agree footprints around natural communities of roughly 30,000 to 60,000 people, so that inequalities are not concealed within larger geographies. Footprints are approved by Health and Wellbeing Boards. National bodies have stated that they will not prescribe an approach beyond the foundational requirements.
Local discretion is appropriate, but no guidance exists on how a natural community should be translated into a boundary, and there is no agreed test of whether a proposed footprint fits the population it is meant to serve. In its absence, systems have relied on existing PCN groupings, ward aggregations, or the defined boundary approach described above.
2. Neighbourhoods are defined by services and their catchments
Patients register with a general practice, not with an administrative area. The same applies to community pharmacy, community nursing and dentistry. A neighbourhood footprint is only operationally meaningful if it reflects where patients receive care, and primary care catchments cross ward and local authority boundaries as a matter of course.
Branch surgeries operate at a distance from their main site, and patients register outside their area of residence for reasons of employment, history and access. In Kent, two LSOAs on the Romney Marsh are allocated by first past the post to a Thanet PCN at the opposite end of the county, because its practices hold 74% and 80% of their registered patients.
“The one on the Romney Marsh is actually part of a surgery in Margate… you’ve got this little outpost down on the Romney Marsh. It just is what it is… I think that’s just reality on the ground, isn’t it?”
Senior analyst, integrated care board
The evidence base is also published at different geographies. Registration and activity data are available at practice level. Deprivation and census outputs are published at LSOA. Planning and electoral accountability sit at ward. Some indicators are available only at MSOA. Pharmacies, clinics and voluntary sector assets are point locations with their own catchments. These geographies do not nest.
“There’s a lot of data that’s just not available at a practice level, but it’s useful, it’s helpful. If data was at ward level, or at school level, or at LSOA level, we would have lookups from all of those other kinds of geographies… so we could pull it all together in one document.”
Senior public health analyst
Not all data is available at patient level, and information governance limits how far record-level linkage can extend. Planning therefore has to work from aggregate data: where registered patients live, which services they use and in what proportion, where those services are located, and at what geography each indicator is published.
3. Registered and resident populations
A second source of error sits beneath the boundary question. The registered population, drawn from GP lists, underpins primary care activity, workforce and most NHS reporting. The resident population, from ONS mid-year estimates and the census, underpins deprivation measures, census characteristics and the wider determinants of health. The two differ. Just over 63 million patients were registered with English practices at October 2026. NHS England's comparison with the 2021 Census found 60.7 million registered against 56.5 million resident.
The difference varies geographically. List inflation is typically greater in urban areas, while rural areas are closer to the census estimate and in some cases below it. A single ICB-wide adjustment factor would introduce its own error.
Every indicator carries a population base, a geography, a reference date and a method of production, and these determine how it can be used. A rate is valid only where numerator and denominator share all four. Projections are more exposed, because growth is observed in the resident population while primary care demand is projected on the registered population. Trend analysis requires a stable geography: where a boundary is recalculated at each release and marginal LSOAs change PCN, real change cannot be separated from reallocation.
4. The two methods
Both methods start from the same input: for each practice and each LSOA, the number of registered patients resident in that LSOA, expressed as a proportion of all patients registered from it.
Defined boundary (first past the post). For each LSOA, identify the PCN whose practices hold the largest number of its registered patients and allocate the whole LSOA to that PCN. Each LSOA has a single PCN, and a PCN's population is the total registered population of the LSOAs allocated to it.
Proportional attribution. Retain each practice–LSOA pair with at least 100 registered patients, rescale the retained proportions in each LSOA to sum to 100%, and aggregate practices to PCN level. A PCN's population is the sum, across the LSOAs it serves, of each LSOA's registered population multiplied by the PCN's proportion. The proportions are then used as weights for all LSOA-level indicators.
For example, an LSOA with 1,500 registered patients may have 600 registered with practices in PCN A, 500 in PCN B and 400 in PCN C. First past the post allocates all 1,500 to PCN A. Proportional attribution attributes 600 to A, 500 to B and 400 to C, and weights every LSOA-level indicator 0.40, 0.33 and 0.27 accordingly.
The maps below show LSOAs shaded by the proportion of their registered patients attending one PCN.
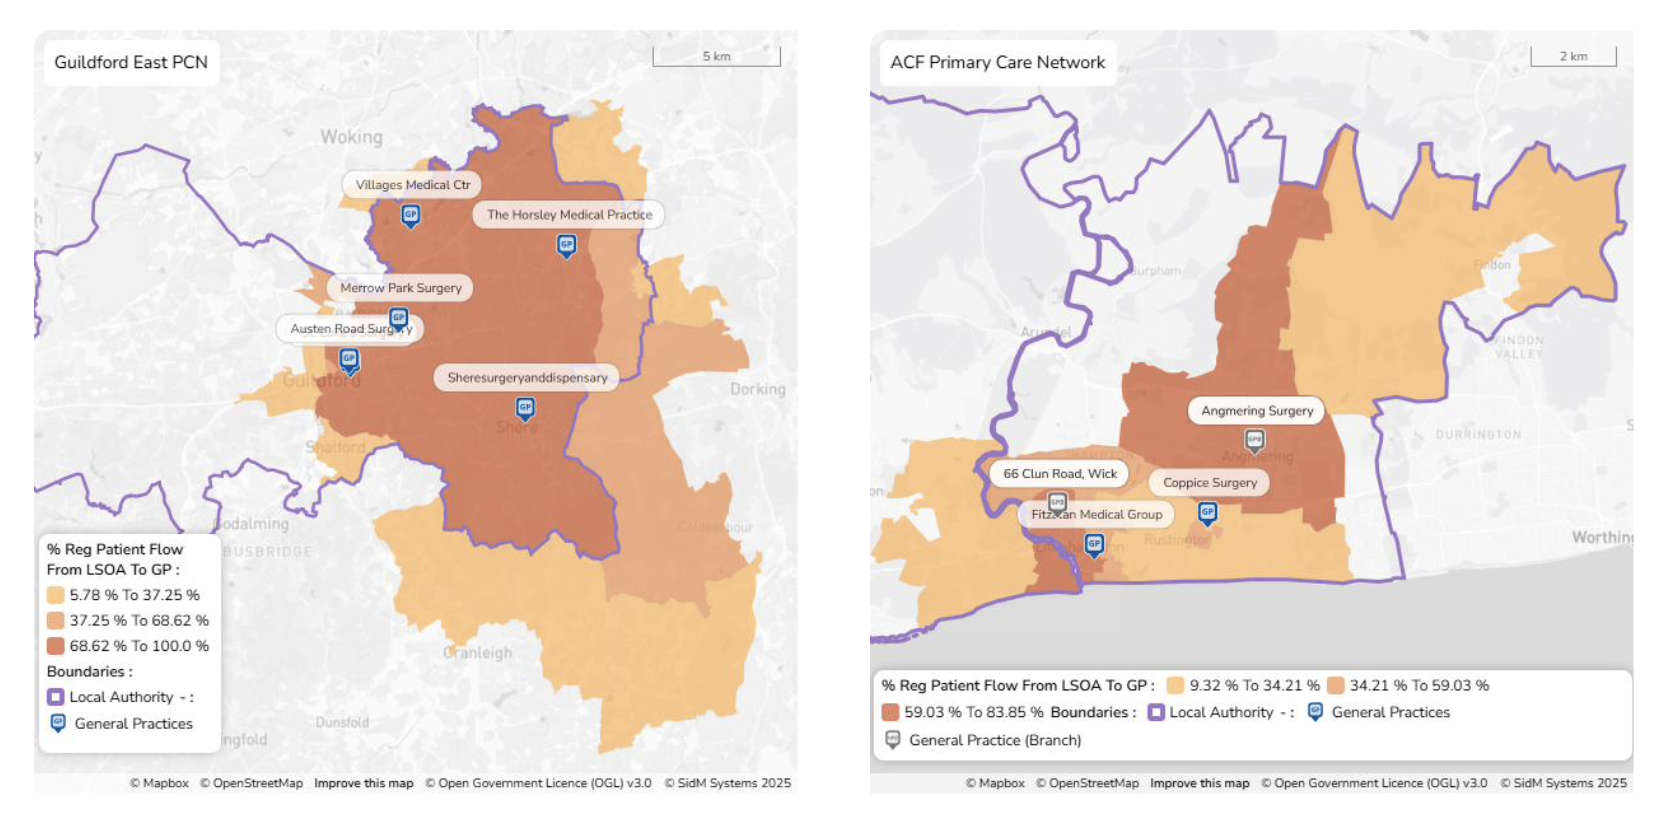
Select the maps to open the full-size image.
Concentrated catchment: Guildford East PCN
Proportions range from 6% to 100%; in 17 LSOAs, mostly rural, the PCN holds all registered patients.
Dispersed catchment: ACF PCN
Proportions range from 9% to 84%; no LSOA is served exclusively by this PCN, and the catchment extends across the local authority boundary.
Catchments are graded rather than bounded. The relevant question for each LSOA is what proportion of it a PCN serves, and that proportion varies considerably between PCNs. Applying a single allocation rule to all of them treats concentrated and dispersed PCNs very differently.
“The proportional method… you’re going to get a more accurate set of transpositions from LSOA to GP registered population. You’ll get a much better view. The downside is if you actually try to look at that on a map, you’re going to get boundary lines intersecting.”
Senior analyst, integrated care board
Overlapping catchments are an accurate representation of registration, not a defect of the method. Where catchments overlap, the map will show it. In exchange, PCN populations reconcile with registered lists, indicators are attributed to the populations they describe, and comparisons between neighbourhoods are valid.
5. Advantages and limitations
Advantages
| Consideration | Defined boundary (first past the post) | Proportional attribution |
|---|---|---|
| Output geography | Mutually exclusive partition of LSOAs. PCN totals are additive with no double counting. | A mappable catchment for each PCN, with each LSOA weighted by the proportion of its registered patients the PCN holds. |
| Denominator | A single unweighted population per PCN, simple to reproduce. | Patients attributed to the PCN they are registered with. Weighted totals reconcile to registered list sizes. |
| PCN types | Adequate for geographically concentrated PCNs: 25 of 73 retain at least 90% of their registered patients. | Dispersed and non-geographic PCNs represented in proportion to their registered population. |
| Trend stability | Stable where a single PCN holds a dominant proportion of each LSOA. | A change in proportion produces a proportionate change in aggregates. No discrete reallocation of LSOAs between releases. |
| Cross-boundary LSOAs | Correctly allocated when the leading PCN is identified against all English PCNs. | Handled directly. ICB-level proportions sum to less than 100% where patients are registered outside the ICB. |
| Implementation | No threshold or weighting parameter. A single join to any LSOA-level dataset. | One method at practice, PCN and MSOA level. Weights are explicit and auditable. |
Limitations
| Consideration | Defined boundary (first past the post) | Proportional attribution |
|---|---|---|
| Output geography | Imposes a discrete partition on catchments that overlap in practice. | Catchments overlap. LSOA counts cannot be summed across PCNs without applying the weights. |
| Denominator | 19.5% of registered patients misclassified. PCN populations differ from registered lists by −77% to +37%. | Patients in practice–LSOA pairs below the minimum count are reallocated through rescaling rather than reported. |
| PCN types | Systematically understates dispersed PCNs and overstates their neighbours (r = −0.57 with mean proportion held). | The minimum count is applied at practice level, so the choice of threshold affects which LSOAs are retained. |
| Trend stability | In 74 LSOAs the two leading PCNs are within 5 percentage points; allocation may change between releases. | Retained LSOAs change as practice–LSOA counts cross the minimum threshold. |
| Data requirement | Requires national data; a regional extract misallocates cross-boundary LSOAs. | Coverage must be reported where ICB-level proportions sum to less than 100%. |
| Auditability | Underlying proportions are discarded once each LSOA is allocated. | Excluded counts are not retained in the lookup, so the effect of the threshold cannot be audited without raw data. |
6. Results
Both methods were applied to England-wide registered patient flow data for 73 PCNs in NHS Kent & Medway and NHS Surrey Heartlands: 274 practices, 1,795 LSOAs and 3.3 million registered patients. The leading PCN in each LSOA was identified against all 1,298 English PCNs, so cross-boundary LSOAs are assessed against all providers serving them.
- 64% of LSOAs served by two or more PCNs
- 19.5% of registered patients misclassified under first past the post
- 48% of PCNs with populations moved 10% or more from registered list size
- 7.3% of LSOAs allocated to a PCN holding under half their registered patients
The error is systematic. Its magnitude is associated with how dispersed a PCN's registered population is (r = −0.57 between mean LSOA proportion held and absolute change in population). Dispersed PCNs are understated and their neighbours overstated. Because the direction of error is determined by a structural characteristic of each PCN, it does not cancel on aggregation.
Population error by catchment concentration, 73 PCNs
The horizontal axis is the mean proportion of LSOA registered patients a PCN holds across the LSOAs it serves: low values indicate a PCN sharing its LSOAs with several others, high values a PCN that is the principal provider throughout its catchment. The vertical axis is the percentage difference between the population allocated by first past the post and the PCN's registered list size; zero indicates agreement between the methods. Concentrated PCNs cluster at zero. Error increases as concentration falls, and the largest understatements occur among the most dispersed PCNs.
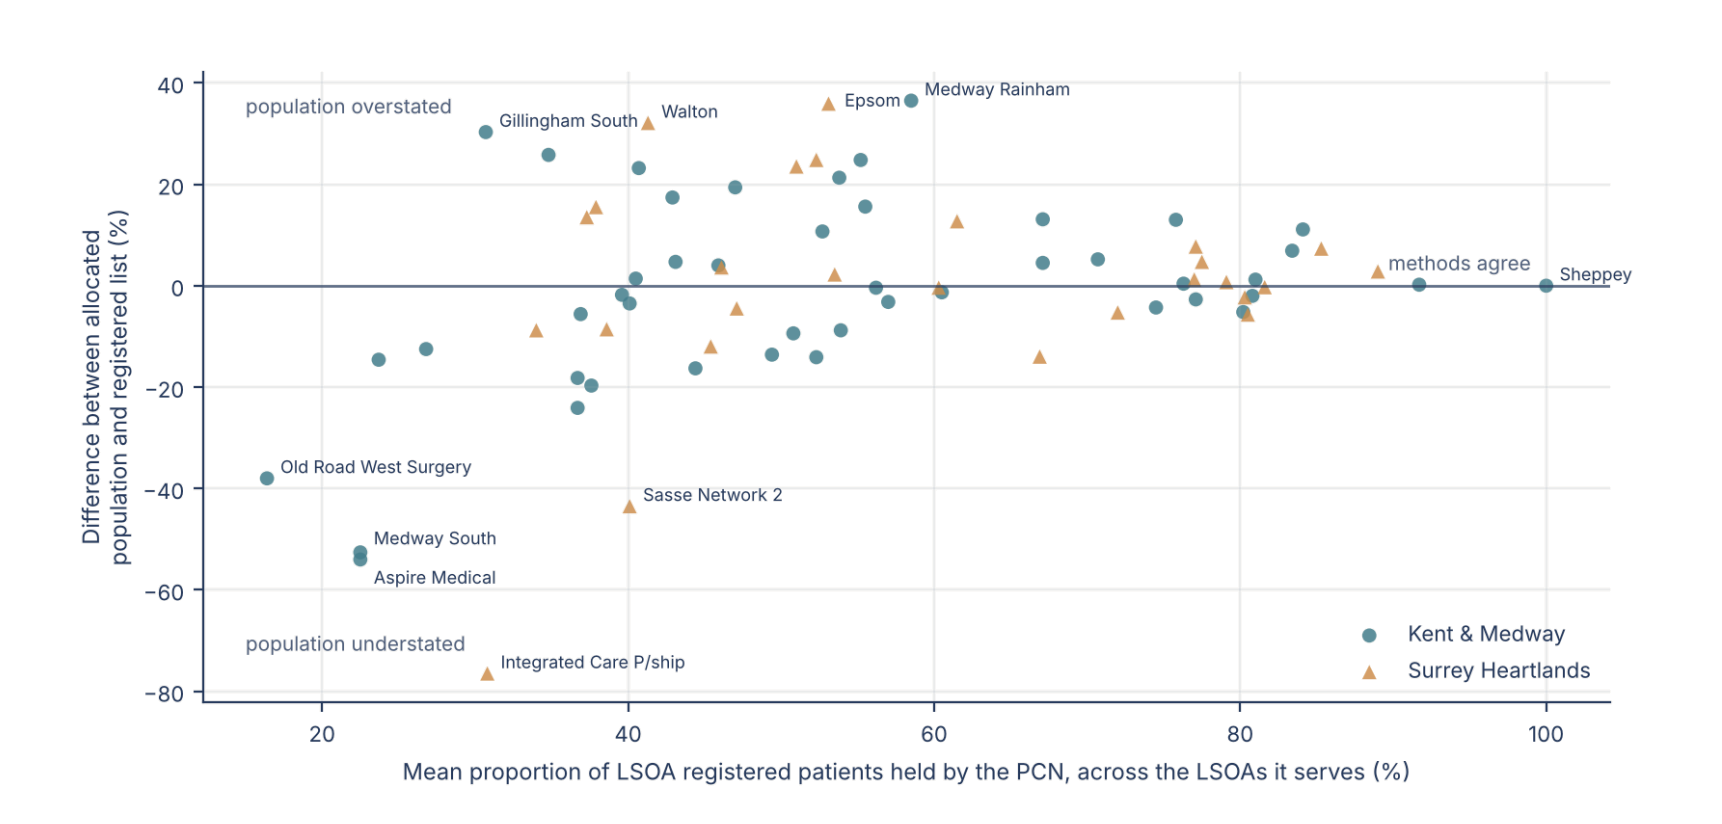
Select the chart to open the full-size image.
Outliers
Four PCNs are understated by more than 40% and four overstated by more than 30%. Integrated Care Partnership in Surrey Heartlands, a single-practice PCN serving 53 LSOAs, holds the largest proportion in only four of them. First past the post assigns it a population of 7,583 against a registered list of 32,249. Aspire Medical and Medway South are each understated by approximately half. Medway Rainham and Epsom absorb patients registered with neighbouring PCNs and are overstated by more than a third.
| PCN | ICB | LSOAs served → allocated | Registered list size | Population under first past the post | Difference | Effect on rates |
|---|---|---|---|---|---|---|
| Integrated Care Partnership | Surrey Heartlands | 53 → 4 | 32,249 | 7,583 | −77% | ×4.26 |
| Aspire Medical | Kent & Medway | 72 → 8 | 30,659 | 14,101 | −54% | ×2.17 |
| Medway South | Kent & Medway | 73 → 8 | 27,921 | 13,248 | −53% | ×2.11 |
| Sasse Network 2 | Surrey Heartlands | 57 → 13 | 41,822 | 23,625 | −44% | ×1.77 |
| Gillingham South | Kent & Medway | 58 → 23 | 27,183 | 35,425 | +30% | ×0.77 |
| Walton Practices Confederation | Surrey Heartlands | 26 → 14 | 20,588 | 27,205 | +32% | ×0.76 |
| Epsom | Surrey Heartlands | 62 → 44 | 63,836 | 86,755 | +36% | ×0.74 |
| Medway Rainham | Kent & Medway | 42 → 33 | 36,186 | 49,389 | +37% | ×0.73 |
The four largest understatements and overstatements among 73 PCNs. “Population under first past the post” is the total registered population of the LSOAs allocated to the PCN, including patients registered with other PCNs. “Difference” is that population relative to the registered list size. “Effect on rates” is the multiplier applied to any rate per 1,000 calculated on that population.
7. The denominator problem
The population within a footprint becomes the denominator for most of the indicators reported against it. Where events are counted by registration and divided by a population defined by boundary, numerator and denominator relate to different populations, and each rate carries an error specific to that neighbourhood.
The effect is material. Rates for Integrated Care Partnership would be inflated by a factor of 4.3, and rates for Epsom reduced to 0.74 of their true value. In a benchmarking report the first would appear as a high outlier and the second as unremarkable, and neither result would reflect the care delivered.
“If you were a PCN and someone presents a report to you and says ‘your population is 40,000’, and you go ‘no, no, hang on a minute, it’s 60,000’ — immediately you’re off to a bad start… Why should I take this report seriously if they can’t even get our population vaguely accurate?”
Senior public health analyst
The consequences are spurious variation between neighbourhoods, attenuation of genuine variation, and an increased false positive rate where neighbourhoods are compared or screened for intervention.
8. Indicator treatment
Proportional attribution is not applied uniformly. Because the weights are explicit, each indicator can be treated according to what the data supports, and some indicators are not weighted.
| Indicator | Treatment | Rationale |
|---|---|---|
| Index of Multiple Deprivation | Weighted. A population-weighted IMD score and decile are derived from the LSOA proportions. | Deprivation varies sharply between adjacent LSOAs. An unweighted catchment average is biased towards the LSOAs in which the PCN holds a small proportion. |
| Census characteristics (e.g. ethnicity) | Not weighted. Percentages are calculated across all LSOAs in the catchment. | An LSOA proportion indicates how many of the LSOA’s patients use the PCN, not which patients. Weighting would assume a distribution the data cannot support. |
| Directly age-standardised rates | Weighted. Proportions are applied to observed events and populations by five-year age band before standardisation. | Assumes the LSOA proportion is constant across age bands. No open dataset reports registration by LSOA and age, so this assumption applies under either method. |
| Resident population projections (ONS) | Weighted. Each PCN receives its proportion of projected LSOA residents. | Prevents residents in overlapping catchments from being counted more than once. |
| Registered list projections | Projected on the registered base and reported separately from resident projections. | Residents convert to registered patients with a lag and at less than one to one. Combining the bases transfers that gap into the projection. |
Age standardisation was the principal methodological challenge raised by public health analysts. Applying a single LSOA proportion across all age bands assumes the proportion does not vary with age, which will not hold exactly. In the absence of registration data by LSOA and age, the assumption is unavoidable under either method. Proportional attribution makes it explicit; first past the post makes a stronger assumption implicitly.
“Maybe it’s not as complicated as I think. Where we have our counts of observed events and population, we split it by five-year age band. There would just be this prior step to calculate the weighted counts and population based on that lookup.”
Senior public health analyst
9. Criteria for a defensible method
First past the post persists because it is simple to compute and to present. The computational argument no longer holds: a practice-to-LSOA flow matrix for an ICB runs to a few hundred thousand rows, and weighting is completed in seconds. Where the bias of a method is measurable and an unbiased alternative carries negligible cost, the choice is methodological.
“That sort of overlappingness is just reality, isn’t it? We kind of know it’s there, and we present an oversimplified version… I generally favour just presenting things truthfully, in the most accurate, representative way.”
Senior public health analyst
- Weight LSOAs rather than allocating them, and retain the weights as the audit trail.
- Calculate proportions against all English practices before filtering to an ICB, so that cross-boundary LSOAs are attributed correctly.
- Determine treatment indicator by indicator: weight where the data supports it, and document the assumption where it does not.
- State the population base for every indicator, and do not combine a registered numerator with a resident denominator.
- Apply a minimum count for each practice–LSOA pair, of the order of 1% of a practice's registered list, to exclude small flows of patients registered from outside the catchment.
- Publish a single lookup for shared use. Where teams derive their own footprints, part of the observed variation between neighbourhoods is variation in method.
About the analysis
73 PCNs, 274 GP practices and 1,795 LSOAs (2021) across NHS Kent & Medway and NHS Surrey Heartlands, using England-wide practice–LSOA and PCN–LSOA registered patient lookups created on 4 September 2026. Leading PCNs were identified against all 1,298 English PCNs. A minimum of 100 registered patients per practice–LSOA pair was applied. Patient counts are modelled from the proportions in the lookup and should be recalculated from raw registration counts before publication. Policy references: the 10 Year Health Plan and the Neighbourhood Health Framework (March 2026). Quotations are from recorded methodology discussions with senior public health and intelligence analysts, edited for transcription errors and anonymised with permission.
About Coplug
Coplug is an AI-native spatial reasoning platform for health and care decision-making, making spatial intelligence accessible to every organisation creating better places.